ESG Dashboard
Product design • Data visualisation
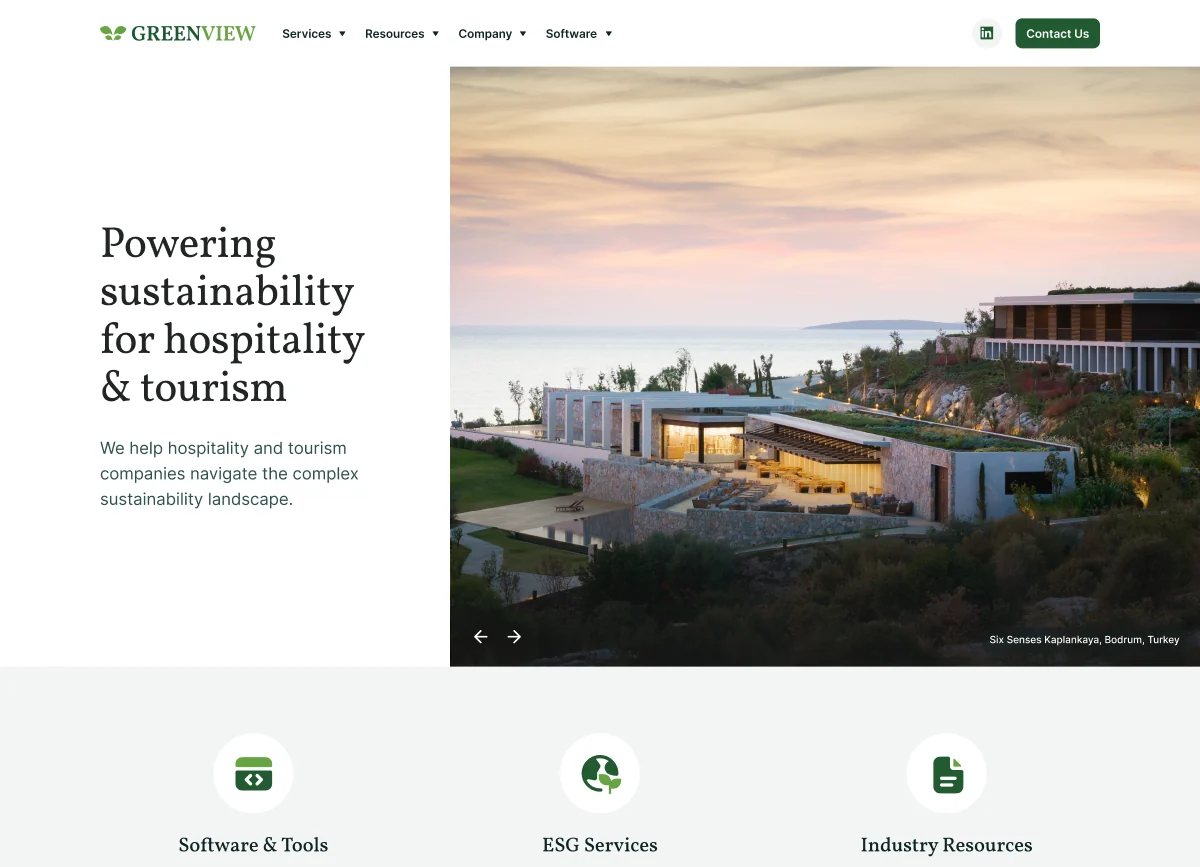
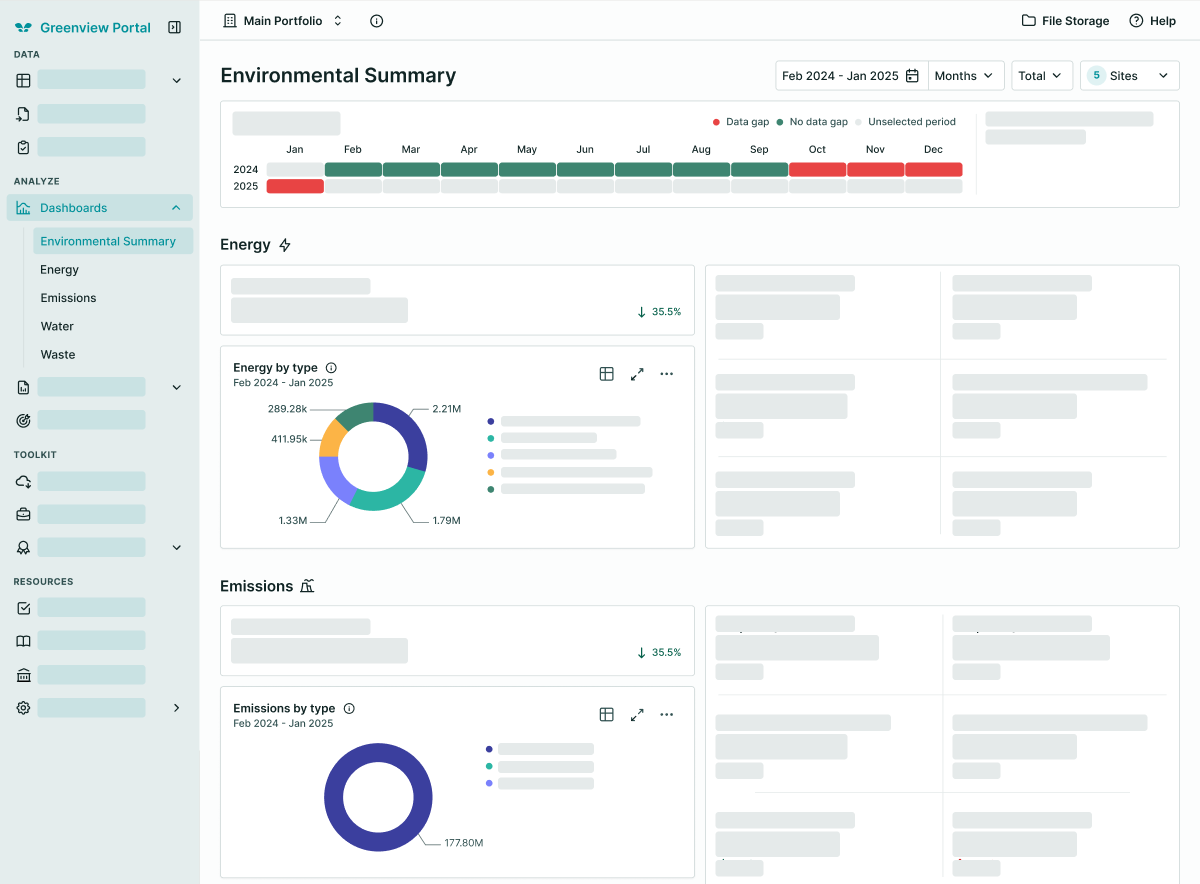
An ESG data dashboard inside the Greenview Portal, used by hotel portfolios to track, manage, and report on sustainability metrics. The project is under NDA, so this page carries the shape of the problem rather than the solution. The approach, the decisions, and the trade-offs I am happy to walk through directly.
Company
Greenview
Role
Product Designer
Year
2025
Background
The specifics are under a non-disclosure agreement, and they stay off this page.
What can be said is the shape of it: sustainability data across energy, water, waste, and emissions, arriving from more than one source, read by people ranging from sustainability specialists to hotel operators with no technical background in any of it.
Design Strategy
The particular decisions are under NDA. In general terms, the work was designing for dense, multi-source sustainability data in a way that stayed usable for both technical and non-technical stakeholders across hotel portfolios — which made the whole project one question, asked repeatedly: how much depth to hold on screen, against how much clarity that depth costs.
That balance never resolved into a rule I could apply once and stop thinking about. It is the interesting part of the project, and it is the part I would rather talk through than summarise here.
Result
Under NDA. I am glad to talk through what shipped and what it changed.
Self Reflection
Working on sustainability data at this scale pushed me to think carefully about making dense, technical data approachable for non-technical stakeholders — a challenge that has shaped how I approach data-heavy design ever since. Energy, water, waste, and emissions are not hard to display. They are hard to display honestly and legibly at the same time.
It is also the project I can say least about publicly, which is its own lesson. Most of what I would want to show is the reasoning, and the reasoning is the part that does not screenshot.